Gold Just Hit $4,000. Here's Why Smart Money Is Still Buying — And What It Means for You
June 1, 2026
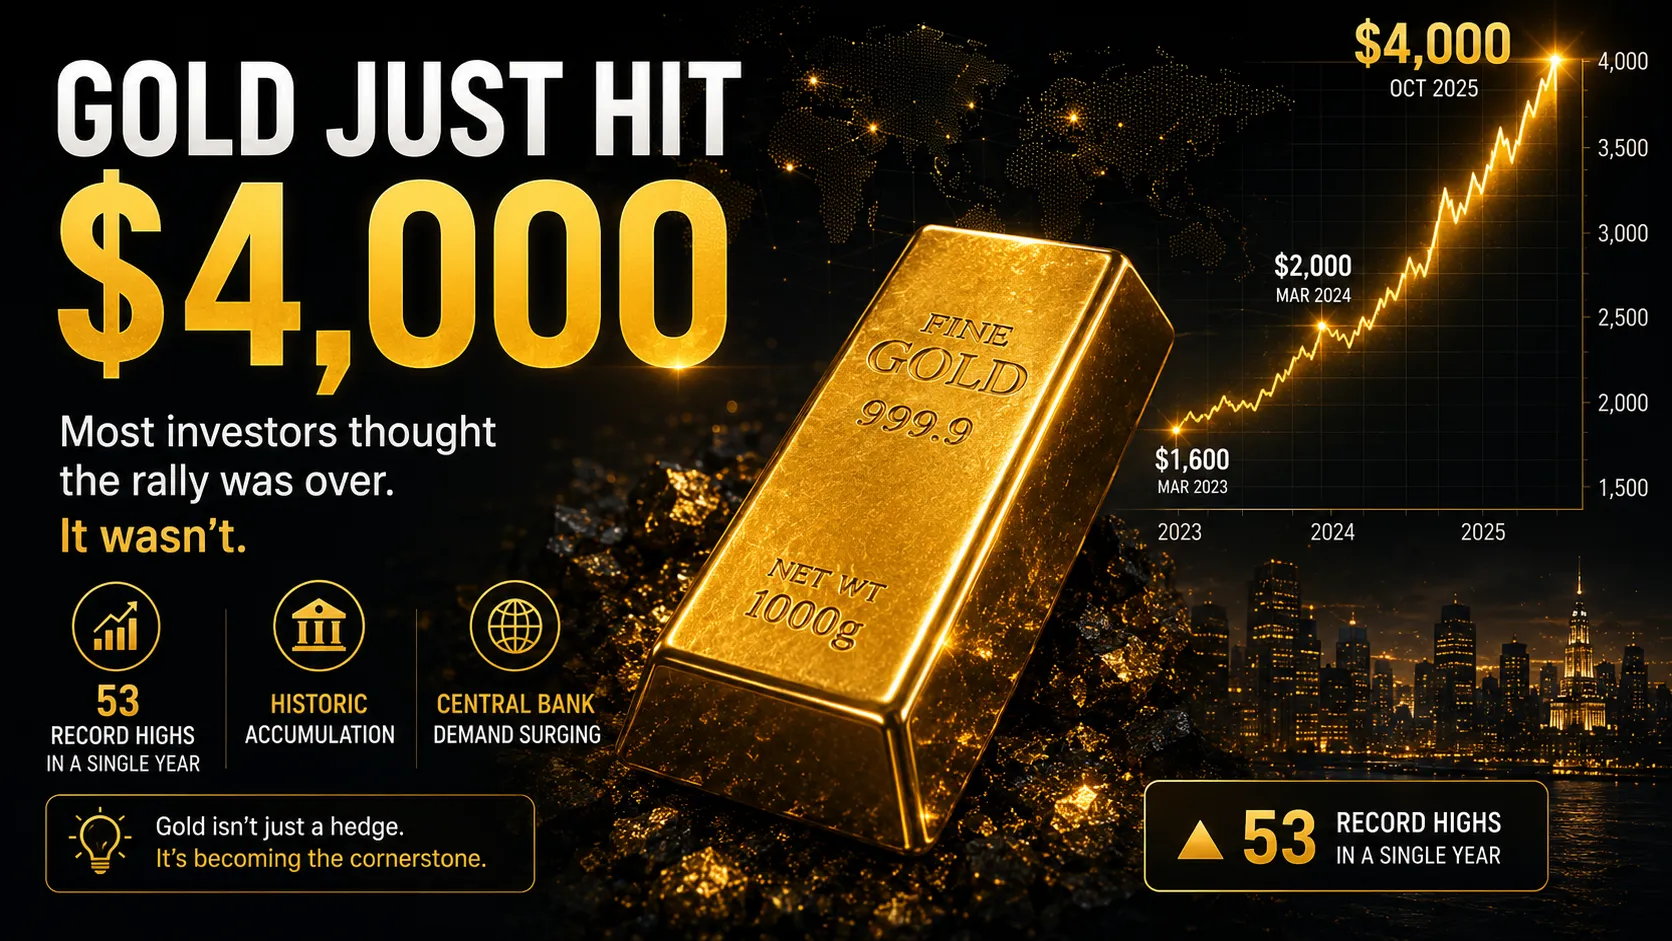
53 record highs in a single year. Central banks accumulating at historic pace. JPMorgan targeting $6,000. The gold story in 2025–2026 is not what most retail investors think it is.
The Number That Surprised Almost Everyone
Gold surpassed $4,000 per ounce for the first time in history in October 2025, capping a rally of nearly 50% for the year — making it one of 2025's top-performing assets across any category.
For most retail investors, that headline lands one of two ways: either they missed it and feel frustrated, or they assume the run is over and the opportunity has passed.
Both reactions are probably wrong.
What Is Actually Driving Gold Right Now
This is not your grandfather's gold rally. The traditional narrative — gold goes up when inflation rises, gold goes down when rates rise — has broken down significantly since 2022. What is driving prices now is more structural.
The gold price set 53 new all-time highs during 2025. Total quarterly demand of 1,303 tonnes in Q4 was the highest ever recorded for a fourth quarter, lifted by hefty ETF inflows of 175 tonnes and a 12-year high in bar and coin buying of 420 tonnes.
Three forces are converging simultaneously:
Central banks are buying at scale — and not stopping. Central bank and investor demand for gold is set to remain strong, averaging 585 tonnes a quarter in 2026. Trade concerns, reduced demand for the US dollar, and increased central bank buying combined to create ideal conditions for this historic upswing. This is not speculative buying. Central banks buy gold to hold for decades.
ETF flows are accelerating. After two years of outflows, gold ETFs reversed sharply in 2025. Institutional money is re-entering through liquid instruments — a signal that professional allocators are rebuilding positions, not trimming them.
Geopolitical risk is not going away. The price increases are a reaction to major policy, geopolitical and economic developments, including tariffs, ongoing conflicts, concerns about the Federal Reserve's independence, and fiscal uncertainty. "Investors are watching gold not just as a hedge against inflation, but as a barometer for everything from central bank policy to geopolitical risk," says Morgan Stanley Research.
What the Institutions Are Forecasting
The forward projections from major financial institutions are notably aligned — and notably bullish.
JPMorgan's 2026 outlook calls for the bull market to continue, with gold demand expected to push prices toward $5,000 per ounce by year-end 2026. "The long-term trend of official reserve and investor diversification into gold has further to run," said Natasha Kaneva, head of Global Commodities Strategy at JPMorgan.
In February 2026, JPMorgan revised its forecast upward again — now projecting gold could reach $6,000 to $6,300 per troy ounce by end of 2026, almost 50% higher than their previous estimate.
Morgan Stanley Research revised its 2026 gold forecast upward to $4,400 per ounce and expects the rally to continue as demand from central banks, ETFs, and retail investors remains strong.

The Participation Gap — And Why It Matters for SEA Investors
Despite the rally, retail participation in gold remains surprisingly low. Just 10.8% of the population invests in physical gold — a much smaller percentage than those who invest in stocks, where a 2025 Gallup poll found that 62% of Americans own stocks.
The reasons are familiar: physical gold requires storage, insurance, and authentication. Gold futures require margin accounts and active management. Gold ETFs require access to foreign exchanges that many SEA retail investors lack through local brokerages.
Tokenized gold changes this calculus. Instead of storing a physical bar or navigating a futures contract, investors can hold a digital token backed by allocated gold, tradeable in fractions, accessible from a mobile phone. The asset is the same. The friction is not.
Is It Too Late to Enter?
The honest answer: nobody knows. Markets do not move in straight lines, and a 50% rally in a single year creates legitimate questions about near-term consolidation.
What the data does suggest is that the structural drivers — central bank accumulation, dollar diversification, geopolitical hedging demand — are not short-term phenomena. They are multi-year trends that began before 2025 and show no clear signs of reversal.
The investors who missed the move from $2,000 to $4,000 are now asking whether they should wait for a pullback to $3,500 — while the institutions are forecasting $6,000.
That tension is worth sitting with before making any decision.
For informational and educational purposes only. All investments carry risk including potential loss of capital. This article does not constitute financial advice.


