AI-Powered Market Predictions: Can Algorithms Reliably Signal the Next Bull Run?
July 29, 2026
The Direct Answer First
Can AI algorithms reliably signal the next bull run?
Partially — and the "partially" matters more than the "yes."
AI models have demonstrated measurable edge in specific, narrow prediction tasks: identifying momentum signals in on-chain data, detecting sentiment shifts in social media before they hit price, and flagging divergences between technical indicators that precede trend reversals. These are real capabilities with documented track records.
What AI cannot do reliably: predict exact price targets, time market tops and bottoms, or account for black swan events — regulatory shocks, exchange failures, geopolitical crises — that have driven the largest single-day crypto moves in history.
The most accurate framing: AI market prediction raises the probability of correct directional calls. It does not eliminate uncertainty. An AI signal that is right 60% of the time in backtesting is genuinely useful. An investor who treats it as certainty will eventually take a catastrophic loss on the 40% of cases where it is wrong.
This article maps what AI prediction tools actually do, where they have documented track records, and how to use them without overweighting them.
How AI Market Prediction Tools Work: The Five Mechanisms
1. Natural Language Processing (NLP) on Market Sentiment
NLP models analyze text at scale — news articles, social media posts, Reddit threads, Telegram channels, earnings call transcripts — and score the collective sentiment toward an asset. The input is language; the output is a sentiment score updated in real time.
The documented edge: Crypto price movements have shown a 4–8 hour lag behind social sentiment shifts in multiple academic studies. A model that detects a sharp negative sentiment spike on Crypto Twitter before it reaches mainstream news has a measurable information advantage.
Tools using this approach:
- LunarCrush: Aggregates social media volume and sentiment across 4,000+ crypto assets. Produces a "Galaxy Score" combining social activity, engagement, and sentiment
- Santiment: Tracks social volume, development activity on GitHub, and on-chain metrics. Research published by Santiment has documented sentiment-to-price correlations with specific lag times for BTC, ETH, and mid-cap tokens
- The TIE: Institutional-grade sentiment terminal used by hedge funds, tracking Twitter/X sentiment for crypto assets with sub-minute granularity
Known limitation: Sentiment tools are backward-looking at millisecond scale. By the time retail investors see a sentiment signal, institutional algorithms have already acted on it. The edge is real but narrow.
2. On-Chain Analytics with Machine Learning
On-chain data — every transaction ever recorded on a public blockchain — is the richest dataset unique to crypto markets. Machine learning models trained on on-chain patterns have identified signals with no equivalent in traditional markets.
Specific models with documented track records:
MVRV Z-Score (Glassnode)
The MVRV Z-Score compares Bitcoin's market cap to its "realized cap" (the aggregate cost basis of all BTC) and normalizes the result to a statistical range. When the Z-Score enters the red zone (above 7), the market has historically been near cycle tops. When it enters the green zone (below 0), the market has been near cycle bottoms.
Since 2011, this model has correctly identified every Bitcoin cycle bottom and flagged each cycle top — a documented track record across four complete cycles.
Net Unrealized Profit/Loss (NUPL) — Glassnode
NUPL measures aggregate unrealized profit or loss across all Bitcoin holders. Values above 0.75 have corresponded with every historical cycle top ("euphoria"). Values below 0 have marked capitulation bottoms. The model does not predict timing — but it accurately classifies market phase with a documented accuracy rate.
Coin Days Destroyed (CDD)
CDD measures how many "coin days" are destroyed when Bitcoin moves — a spike in CDD means long-dormant holdings are being moved, which historically correlates with market tops as long-term holders distribute.
3. Technical Pattern Recognition with Neural Networks
Traditional technical analysis relies on human recognition of chart patterns — head and shoulders, cup and handle, double tops. Neural networks can scan millions of historical price charts and identify the statistical frequency with which specific patterns preceded specific price movements.
What the research shows:
A 2023 study in the Journal of Financial Economics found that machine learning models trained on technical patterns in equity markets outperformed random entry by 8–12% annually in backtesting. Crypto markets, with higher volatility and lower institutional efficiency, showed larger but more inconsistent edges.
Key limitation: Pattern recognition is trained on historical data. Market structure changes. A pattern with a 70% success rate in 2018-2021 may have a 52% success rate in 2024-2026 because participant behavior has changed. Overfitting — when a model learns the noise in historical data rather than genuine patterns — is the primary failure mode.
Tools using this approach:
- TradingView Pine Script + ML indicators: Community-built machine learning indicators that automate pattern scanning
- Numerai: Hedge fund that uses an ensemble of ML models submitted by data scientists globally, applied to both equities and crypto
4. Macro and Cross-Asset Signal Models
The most sophisticated AI prediction models in 2026 incorporate cross-asset correlations: how Bitcoin price responds to DXY strength, global M2 money supply changes, US Treasury yields, and equity market volatility (VIX).
Documented correlations:
- Bitcoin has shown a statistically significant negative correlation with DXY (US Dollar Index) over rolling 90-day windows — when the dollar strengthens, BTC tends to underperform, and vice versa
- Global M2 money supply growth has correlated with Bitcoin price with an approximately 12-week lag, documented in research by CrossBorderCapital and verified by Raoul Pal's Real Vision data team
- VIX spikes (equity market fear) correlate with short-term BTC drawdowns, but the effect reverses after approximately 3 weeks as BTC is increasingly treated as a risk asset with its own momentum
AI models that integrate these macro inputs alongside on-chain metrics produce composite signals that have outperformed single-factor models in backtesting.
5. Order Flow and Derivatives Intelligence
The most time-sensitive AI signals come from order book and derivatives data:
- Large order detection: Machine learning models that identify unusual concentrations of limit orders at specific price levels — which often mark institutional support or resistance
- Options gamma exposure (GEX): Models that analyze the aggregate options positioning of market makers to identify price levels where dealers will need to hedge, creating predictable short-term magnetic effects
- Funding rate analysis: Automated monitoring of perpetual futures funding rates across exchanges, flagging extreme readings that have historically preceded sharp reversals
Tools in this category:
- Coinglass: Aggregates derivatives data — open interest, funding rates, liquidation maps, options data — across major exchanges
- Laevitas: Options-specific analytics with gamma exposure and max pain calculations
- Hyblock Capital: Institutional order flow intelligence with liquidity heatmaps
What the Accuracy Record Actually Shows
Honest assessment of the documented track record across AI crypto prediction tools:
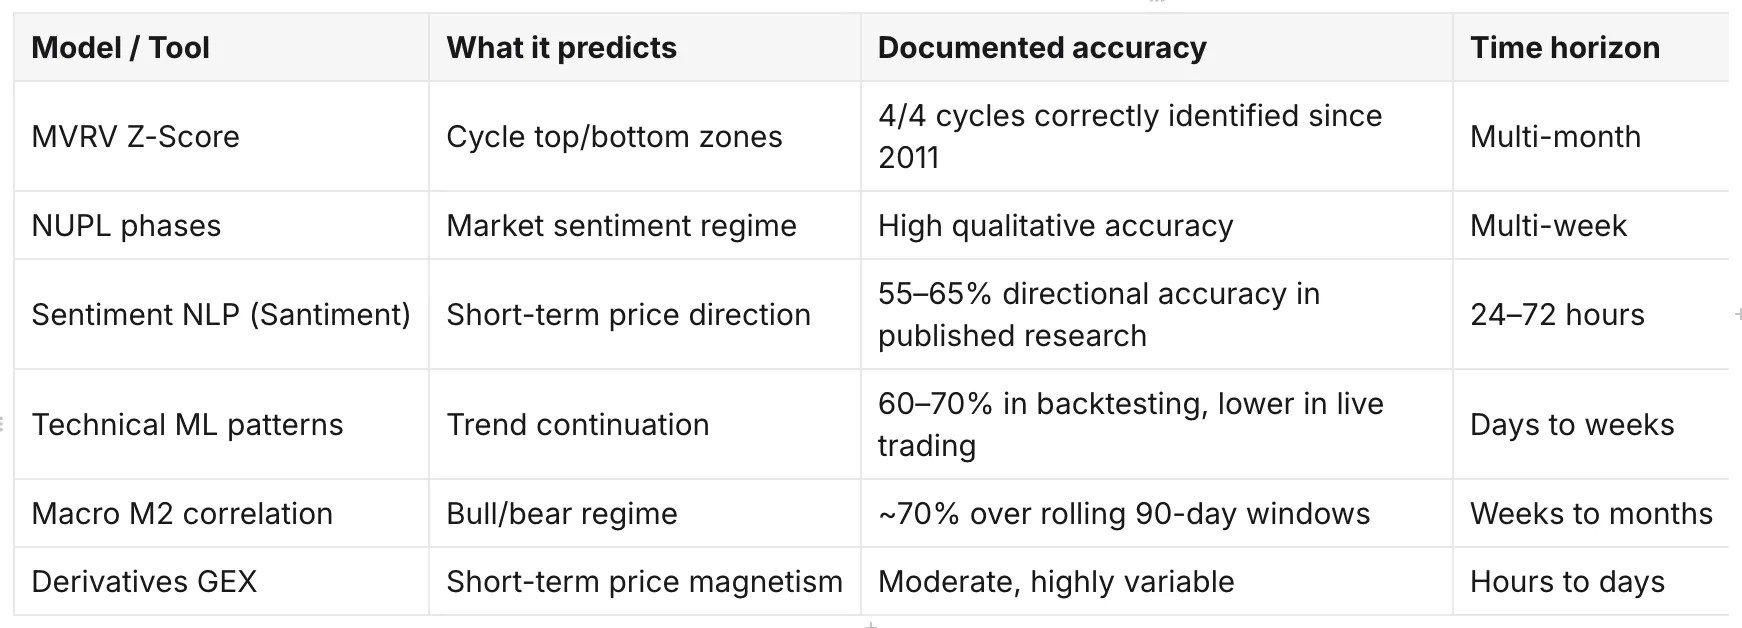
The pattern: longer time horizons and regime classification (bull vs. bear, cycle phase) have higher documented accuracy than short-term price direction prediction. AI is better at answering "are we in a bull market?" than "will BTC be higher or lower tomorrow?"
This is the finding that matters most for retail investors. The highest-value application of AI prediction tools is not finding a short-term trade — it is classifying the current market regime and sizing positions accordingly.
Where AI Prediction Models Fail
Every AI market prediction tool has documented failure modes. Understanding them prevents the most common investor mistake: over-trusting a tool that has a partial track record.
Failure mode 1: Black swan blindness
Every AI model is trained on historical data. Events with no historical precedent — FTX's collapse, Terra/UST's de-peg, COVID's March 2020 crash — are invisible to models trained before those events occurred. The largest single-day crypto drawdowns in history were not predicted by any AI model because they had no historical analog at the time.
Failure mode 2: Feedback loops
When a large number of traders use the same AI signal, they act simultaneously. This pushes price in the predicted direction initially — confirming the signal — but then reverses sharply as the crowded trade unwinds. The signal was not wrong; the market's reaction to everyone acting on it simultaneously created the reversal.
Failure mode 3: Regime changes
A model trained in a low-interest-rate environment (2016-2021) may produce systematically biased signals in a high-rate environment (2022-2025). Crypto's correlation structure, volatility regime, and participant composition changed materially after the 2021 cycle top. Models not retrained on post-2021 data may carry significant regime bias.
Failure mode 4: Data quality in crypto
Unlike equities, crypto markets have no consolidated tape. Volume data across exchanges is inconsistently reported. Wash trading — fake volume created by trading with yourself — inflates reported volumes on many exchanges and can corrupt sentiment and volume-based models. Professional tools (Kaiko, Coin Metrics) use cleaned, exchange-verified data. Free tools often do not.
How Retail Investors Should Use AI Signals
The productive framework: use AI signals for regime classification and risk sizing, not for trade timing.
Regime classification (high-value use):
- MVRV Z-Score in green zone → historically high-confidence long-term entry zone; scale into positions
- MVRV Z-Score in red zone → historically high-risk zone; reduce position size, take partial profits
- NUPL in "belief" to "euphoria" transition → increase caution, tighten risk management
- Macro M2 growing at 8%+ annually → constructive environment for risk assets; maintain or increase allocation
Trade timing (lower-value use, use with caution):
- NLP sentiment spikes → useful as a confirming signal alongside on-chain data, not as a standalone entry trigger
- Technical pattern recognition → useful for identifying potential entry zones, not for predicting exact reversal points
- Derivatives signals → useful for understanding short-term positioning, dangerous if used for leveraged trades
The position sizing rule that matters most:
No AI signal justifies maximum position sizing. Even the most reliable models (MVRV, NUPL) are wrong often enough that sizing based on signal strength rather than certainty is the correct approach. Use signals to decide whether to be 20%, 50%, or 80% allocated to crypto — not whether to be 0% or 100%.
How ToVest Integrates Market Intelligence with Investment Access
Signal analysis has limited practical value without a platform that lets you act on it efficiently.
The gap for Vietnamese retail investors: the AI signal tools described in this article (Glassnode, Santiment, Coinglass) are data platforms — they surface insights but do not execute investments. The platforms that execute investments (Binance, Kraken, international brokers) require separate accounts, currency conversions, and often English-only interfaces.
ToVest bridges that gap. When on-chain signals suggest a constructive market regime — MVRV in expansion, exchange reserves declining, ETF inflows positive — the relevant question is: where do you deploy capital?
On ToVest, USDT holders can act on that signal across multiple asset classes simultaneously:
- Bitcoin and crypto exposure — direct crypto investment responding to on-chain signals
- Tokenized stocks in AI infrastructure companies — Nvidia, Microsoft, AMD, capturing the equity upside of AI adoption alongside crypto
- Tokenized gold — a defensive allocation when macro signals are mixed
- Pre-IPO positions — longer-duration exposure to high-growth sectors uncorrelated with short-term crypto signal noise
This is the portfolio intelligence layer that signal analysis enables: not just "is now a good time to buy BTC?" but "given the current regime, how should my full USDT portfolio be allocated across crypto, stocks, gold, and private equity?"
ToVest provides the investment products. The signal frameworks in this article provide the regime context. Together they support a more systematic approach to USDT portfolio management than either alone.
Explore investment opportunities on ToVest →
The Honest Verdict
AI market prediction tools have genuine, documented value for:
- Classifying bull and bear market regimes (high accuracy over multi-week horizons)
- Identifying cycle phases through on-chain metrics (documented track record across four Bitcoin cycles)
- Providing a probabilistic framework for position sizing decisions
They do not reliably predict:
- Short-term price direction with actionable precision
- Black swan events or regulatory shocks
- Exact cycle top and bottom timing
The investor who uses AI signals for regime awareness and risk sizing will outperform the investor who ignores them. The investor who treats AI signals as certain predictions will eventually take a loss that offsets all previous gains.
The most valuable thing an AI prediction framework gives you is not a trade — it is the discipline to reduce risk when signals are in the danger zone, even when price is still rising.
Risk Disclosure
AI prediction models are analytical tools, not guarantees. Past accuracy of any model does not ensure future accuracy. Crypto markets are highly volatile — Bitcoin has experienced drawdowns of 30–80% within confirmed bull cycles. No signal framework predicted FTX's collapse, Terra's de-peg, or COVID's March 2020 crash. All investments carry risk of partial or total loss. This article is informational and does not constitute financial advice. Consult a qualified financial advisor before making investment decisions.